Many comparative genomic studies try to get a grasp on the overall gene content of a species. However, with the current explosion of available genomic data, it becomes more complex to use all-vs-all genome comparison approaches. Over the last years, the concept of pangenome emerged, whose goal is to capture the overall diversity of a taxonomic group.
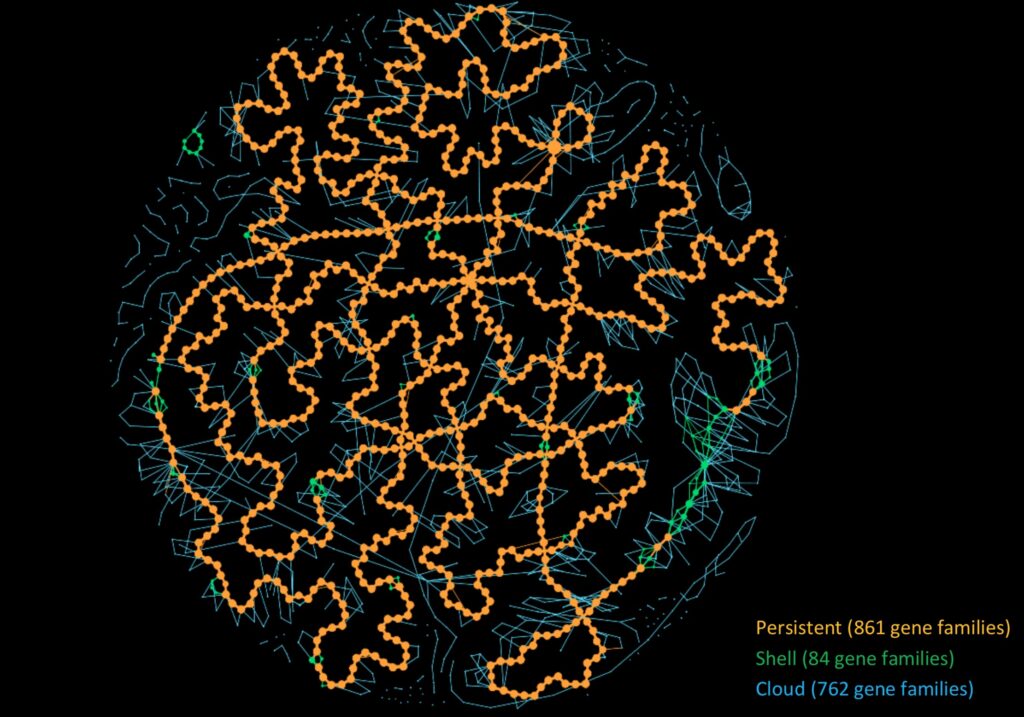
PanGBank collects pangenomes for all genomes of the NCBI GenBank and RefSeq databases (>500K genomes). It uses the PPanGGOLiN bioinformatics method that computes pangenomes not based on the core and accessory paradigm but on multiple statistically inferred partitions. PPanGGOLiN also brings a graph-based solution to represent thousands of genomes in a partitioned pangenome graph.
In order to build a PanGBank release, we use the GTDB taxonomy to assign genomes to species with the purpose of building a more homogeneous and correct classification than the one from the NCBI. Then, we build pangenomes for each species that has a sufficiently high number of affiliated genomes (≥15) to apply the PPanGGOLiN statistical partitioning method. Afterward, PanGBank can be used as a reference resource (i) to predict Regions of Genome Plasticity (RGP) and identify insertion hotspots with the panRGP method (ii) to evaluate the completeness of genomes (iii) to visualize and analyze pangenomes according to their gene content among the different partitions.
PanGbank is available here: https://pangbank.genoscope.cns.fr
In a final goal, the PanGBank resource will be made available in the MicroScope platform for comparative genomics.