
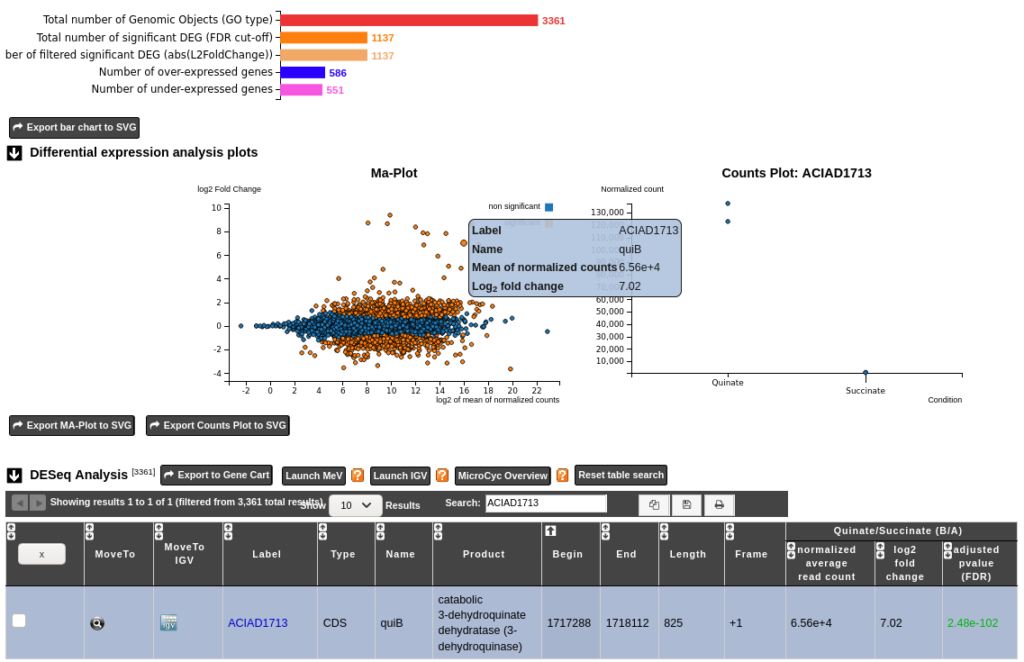
Two novel interactive graphs have been added to the RNA-seq analysis page to summarize, control and explore more deeply the Differentially Expressed Gene (DEG) results.
- A colored horizontal bar chart displays global statistics for the selected comparison(s).
- A MA-plot displays an overview of the results by plotting the log fold change between the selected experimental conditions against the mean expression across all the samples for each gene.
- By clicking on a gene on the MA-plot, it selects the corresponding table entry and displays additional information in a pop-up.
- A Counts-plot displays for each gene, the normalized counts of all samples grouped by experimental conditions.
Feel free to browse our user documentation for further information.
Interactive MA-plot and Counts-plot to improve the exploration of RNA-Seq DEG